India’s real estate sector is entering a structural growth phase driven by urbanisation, premium housing demand, commercial expansion, and infrastructure push. Among the strongest beneficiaries of this trend is DLF Ltd, one of India’s largest listed real estate developers.
The complete assessment will focus on analyzing DLF’s present financial situation its core business metrics and its shareholder distribution together with its projected expansion to determine both its realistic and optimistic stock price projections through the year 2050.
Company Overview
DLF Ltd stands as one of India s leading and most established real estate developers who specializes in developing luxury residential properties together with premium commercial spaces and retail centers. Through the years the company has established itself as a market leader in Gurugram and NCR while it continues to grow its collection of high-end residential properties and Grade-A office spaces.
DLF’s extremely low debt level and rising profitability indicate a structurally stronger company compared to its past cycles. The business is increasingly focusing on high-margin luxury projects and rental commercial income, which improves earnings visibility.
Financial Overview
Current Share Price
Revenue and Profit Growth Growth Analysis
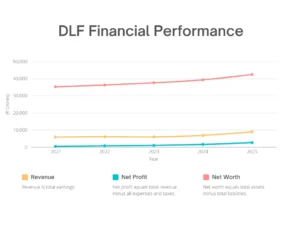
| Year | Revenue | Profit | Net Worth |
|---|---|---|---|
| 2021 | 5,945 | 477 | 35,364 |
| 2022 | 6,138 | 844 | 36,382 |
| 2023 | 6,012 | 1,101 | 37,692 |
| 2024 | 6,958 | 1,630 | 39,432 |
| 2025 | 8,996 | 2,695 | 42,550 |
Revenue Growth
Revenue increased from ₹5,945 Cr in 2021 to ₹8,996 Cr in 2025. The 2025 results show a significant increase because of high demand for premium housing and improved project delivery methods.
Profit Growth
Profit grew from ₹477 Cr to ₹2,695 Cr in five years — more than 5x growth. This shows:
- Strong margin expansion
- Better cost control
- High operating leverage
Net Worth Expansion
Net worth rose steadily from ₹35,364 Cr to ₹42,550 Cr. This strengthens book value and reduces financial risk.
Balance Sheet Strength
- Debt to Equity: Just 0.04
- Promoter Holding: 74.08%
DLF has significantly reduced leverage compared to past real estate cycles, making it financially more stable.
Overall, the last five years show a clear turnaround and structural improvement.
DLF Fundamental Metrics (As of February 2026)
| Key Metrics | Value |
|---|---|
| Market Capitalization | ₹1,59,014 Cr |
| P/E Ratio (TTM) | 35.91 |
| Industry P/E | 35.63 |
| EPS (TTM) | ₹17.89 |
| Return on Equity (ROE) | 9.96% |
| Dividend Yield | 0.93% |
| Debt to Equity Ratio | 0.04 |
| 52-Week Low | ₹586.65 |
| 52-Week High | ₹886.80 |
| Website | DLF India |
DLF is currently trading near its 52-week lower range, while valuations are aligned with the industry average P/E. The extremely low debt-to-equity ratio indicates strong balance sheet discipline.
Key Factors of DLF Share Price Target
The long-term share price targets up to 2050 are based on these core drivers:
1. EPS Growth Potential
Current EPS (TTM): ₹17.89
If DLF delivers 15–20% CAGR earnings growth through:
- Luxury housing sales
- Commercial leasing income
- Land monetisation
- Rental asset expansion
EPS can compound significantly over the next 10–20 years.
2. P/E Re-rating Possibility
Current P/E: 35.91
Industry P/E: 35.63
If DLF transitions into a stable cash-generating real estate giant with strong rental income, the market may reward it with:
- P/E expansion to 40–50 in the long term
This re-rating can significantly boost share price potential.
3. Premium Housing Demand
India’s affluent population is rising rapidly. Luxury and high-ticket housing demand remains strong in:
- NCR
- Mumbai
- Bengaluru
DLF’s brand positioning gives it pricing power in premium segments.
4. Commercial & Rental Income Growth
Commercial leasing provides predictable recurring income. As rental assets grow:
- Cash flow stability improves
- Valuation quality improves
- Downside risk reduces
This supports long-term compounding.
DLF Share Price Target 2026
By 2026, DLF’s performance will largely depend on continued luxury housing demand and strong pre-sales momentum. With EPS expected to grow toward ₹21–₹23 and P/E sustaining near 36–40, the stock may regain upward traction. If execution remains strong and margins stay healthy, DLF share price target 2026 could range between ₹750–₹900.
DLF Share Price Target 2030
DLF Share Price Target 2035
By 2035 DLF will become a stronger rental-income developer because they will achieve better cash flow visibility. The market valuation of DLF will create long-term value when EPS reaches ₹85 to ₹95 and the market assigns a 45 to 48 P/E multiple. DLF share price target 2035 may trade between ₹3,800 and ₹4,500 because urban development in India will support DLF’s business growth.
DLF Share Price Target 2040
In 2040, DLF’s scale, brand power, and land bank strength may position it as a dominant premium developer. The valuation of DLF will increase because EPS will reach a range between ₹140 and ₹160 while P/E will reach a range between 45 and 50. If real estate demand continues to remain strong DLF share price target 2040 will reach a range between ₹6,500 and ₹8,000.
DLF Share Price Target 2045
By 2045, long-term compounding in commercial rentals and luxury housing can transform earnings significantly. If EPS climbs to ₹220–₹250 and P/E remains in the 48–52 band, sustained wealth creation is possible. Under stable economic growth, DLF share price target 2045 could move toward ₹10,500–₹13,000.
DLF Share Price Target 2050
Looking at 2050, DLF’s success will depend on multi-decade execution, land monetisation, and recurring rental income growth. If EPS expands to ₹350–₹400 with a 50–55 P/E range, premium valuation may sustain. In such a scenario, DLF share price target 2050 could potentially reach ₹17,500–₹22,000.
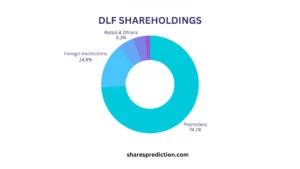
DLF Shareholding Pattern
| Category | Holding |
|---|---|
| Promoters | 74.08% |
| Foreign Institutions | 14.81% |
| Retail & Others | 5.34% |
| Mutual Funds | 4.12% |
| Other Domestic Institutions | 1.66% |
Promoters maintain a very high stake, showing strong long-term commitment. Institutional ownership remains healthy, supporting long-term stability.
Conclusion
DLF is no longer just a cyclical real estate developer. The company has Finalized a strong balance sheet, low debt structure, rising profitability, and growing premium brand strength.
At ₹620, the stock is trading near its 52-week lower zone while earnings momentum remains strong. If DLF sustains 15–20% long-term EPS growth, the company has the potential to become a major wealth creator by 2030, 2040, and beyond.
Long-term investors who understand sector cycles and remain patient may benefit significantly from India’s structural real estate growth story.
FAQs About DLF
1. What is DLF’s current share price in 2026?
DLF is trading around ₹620 as per the latest update.
2. What is DLF’s P/E ratio?
The current P/E ratio (TTM) is 35.91.
3. Is DLF financially strong?
Yes. With a debt-to-equity ratio of 0.04 and rising net worth, DLF’s balance sheet is strong.
4. Is DLF a debt-free company?
It is not completely debt-free but operates with very low leverage compared to industry standards.
5. What is DLF’s EPS?
The current trailing twelve months EPS is ₹17.89.
6. Does DLF pay dividends?
Yes. The dividend yield is approximately 0.93%.
7. What are the major risks in DLF stock?
Real estate slowdown, high interest rates, regulatory changes, and execution risks.
8. Can DLF double by 2030?
If earnings compound at 15–20% CAGR and valuations remain stable or expand, doubling by 2030 is possible.
9. Is DLF good for long-term investment?
For investors with a long-term horizon and understanding of sector cycles, DLF can be a strong candidate.
10. What should investors track before investing?
Monitor EPS growth, debt levels, project launches, presales data, and commercial leasing performance.
Disclaimer
The information provided in this blog is for educational purposes only and does not constitute financial advice. Investors should conduct their own research before making investment decisions.
Call to Action
The latest share price predictions and expert analysis are available on Sharesprediction.com for you to check frequently. Our research provides essential information which enables investors to make better investment choices based on market data and trends analysis.
